Uptime Kuma: A Status Page for Services Only You Use
The little green dashboard that tells you a service is down before you go looking for it
Contents
There is a particular flavour of homelab embarrassment where you discover a service has been down for three days and the only reason you find out is that you went to use it. The backup web UI, the RSS reader nobody but you touches, the DNS resolver that quietly fell over on Tuesday — the things that have no users to complain, so nothing complains, and the failure sits there invisibly until it inconveniences you personally at the worst moment.
A status page fixes this, and here is the counterintuitive part: it is worth building even when the audience is exactly one person. Big companies run status pages so customers can check whether an outage is on their end. You run one so that you find out a service is down from a notification instead of from a broken bookmark. The dashboard is for the machine that has no other advocate.
Uptime Kuma is the tool I use for this, and it has quietly become one of the most recommended self-hosted apps going, for good reason. It is a single application written by one developer (Louis Nielsen, who publishes as louislam), it stores everything in an embedded SQLite database, and it does one job — checking whether things are up and telling you when they are not — with a polish that puts a lot of commercial monitoring to shame.
Why a status page beats scattered checks
Before Uptime Kuma I had monitoring, technically. A cron job that curled a couple of endpoints. A script that pinged the router. The trouble with that arrangement is that each check lives alone: it knows whether its thing is up, it has its own idea of how to shout about a failure, and there is no single place to glance at and go “everything’s green”. When you have fifteen services, fifteen bespoke checks is fifteen things to maintain and nowhere to look.
The value of a status-page tool is consolidation. One place defines every check, one place shows the current state of everything, one place holds the history so you can answer “how often does this actually fall over?”. That last part matters more than it sounds — a service that drops for ninety seconds every night is telling you something, and you only ever notice the pattern when the checks share a timeline. Reaching for a single tool that owns the whole job, rather than a drawer of shell scripts, is the same instinct that makes self-hosted dead-man switches worth centralising too.
Standing it up
It is one container and a volume for the SQLite database. There is no external database to provision and nothing else to wire up.
| |
Bring it up, open port 3001, and the first-run screen has you create an admin account. That is the entire install. The :1 tag pins you to the 1.x major so a future breaking release doesn’t surprise you on a docker compose pull; the app has been on the 1.23 line through the first half of 2024 and updates within it have been safe.
One thing to get right on day one: put the data volume somewhere your backups actually reach. The whole history — every monitor, every notification config, every recorded outage — lives in that single SQLite file. Losing it means rebuilding all your checks by hand, which is exactly the tedium the tool exists to save you.
The monitor types that earn their keep
Uptime Kuma can check a lot of things, and the temptation is to add a monitor for everything you own. Restraint pays off; a wall of green that includes checks you don’t care about trains you to ignore the wall. These are the types I actually use.
- HTTP(s) — the workhorse. Point it at a URL, and it flags DOWN on a connection failure or a non-2xx response. Crucially it also watches your TLS certificate expiry and warns you weeks before a cert lapses, which has saved me from at least one self-inflicted outage.
- HTTP keyword — same, but it also checks the response body contains (or doesn’t contain) a string. This is how you catch the nastier failure where a service returns a cheerful
200 OKbut the page itself is an error. A health endpoint that returns the wordhealthyis the ideal target. - TCP port — for the things with no web interface: a database, an SSH daemon, a mail port. It just checks the port accepts a connection.
- Ping — reachability of a host, for the router or a switch or a NAS that should always answer.
- DNS — resolves a record against a specified server and can assert the answer, so you notice when your resolver starts handing back the wrong address.
- Docker — talks to the Docker socket and reports whether a named container is running, which catches the crash-loop case a port check might miss.
Each monitor has an interval (I run most at 60 seconds), a retry count before it declares DOWN, and a set of notifications to fire. The retry setting is the difference between a useful alert and a jumpy one — a single failed check on a home connection is often just a blip, so I require two or three consecutive failures before anything shouts.
Notifications: routing the shout
A monitor that detects a failure and does nothing with that knowledge is decoration. Uptime Kuma supports something like ninety notification channels — email, Telegram, Discord, Slack, ntfy, generic webhooks, and a long tail of others — and you attach one or more to each monitor.
My setup is deliberately tiered. Low-stakes services (the RSS reader) notify a Telegram channel I check when I feel like it. The load-bearing stuff (DNS, the reverse proxy, backups) fires to ntfy, which pushes to my phone and actually makes a noise. The point of tiering is to keep the loud channel meaningful; if every trivial blip screams, you start swiping the screams away, and the one that mattered goes with them. That discipline — matching the urgency of the alert to the importance of the thing — is the entire subject of tuning alerts so they don’t cry wolf, and it applies just as much to a fifteen-service homelab as to a production fleet.
Uptime Kuma also sends a recovery notification when a service comes back, which sounds minor and is not. Knowing something is down is half the information; knowing it fixed itself while you were making coffee saves you a pointless trip to the terminal.
The status page itself
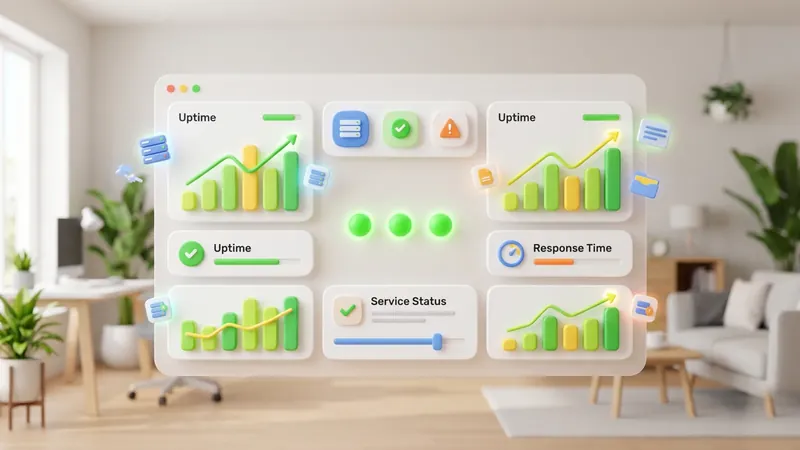
Beyond the private dashboard, Uptime Kuma can publish one or more status pages — a clean public (or, behind your reverse proxy, private) page grouping monitors into sections, with uptime percentages and incident history. Even for services only I use, I keep a status page bookmarked because it answers the “is it me or is it the thing?” question in one glance, from any device, without logging in.
If you host anything a family member or a friend touches — a shared photo library, a game server, a file drop — the status page earns its keep socially, too. Instead of fielding “is the thing broken?” messages, you send them a link once, and they check it themselves.
Heartbeats: monitoring the jobs that have no port
The one monitor type I saved for its own section is Push. Instead of Uptime Kuma reaching out to check a service, it sits and waits for the service to check in. It gives you a URL; something on your side has to hit that URL on a schedule, and if the check-in doesn’t arrive within the window you set, the monitor goes DOWN.
This inverts the whole model, and it is how you monitor things that have no endpoint to poll — a nightly backup script, a cron job, a data sync. The job curls the push URL as its last successful step, and silence becomes the alarm.
| |
Because the curl is the last line and the script uses set -e, any earlier failure aborts before the heartbeat fires, Uptime Kuma hears nothing, and you get told the backup didn’t run. This is the same dead-man’s-switch idea that deserves a fuller treatment of its own, and Uptime Kuma gives you a perfectly good version of it for free.
Troubleshooting
Everything shows DOWN right after install, but the services are fine. Container networking. Uptime Kuma inside a container resolves and reaches hosts from its own network namespace rather than the host’s. localhost from inside the container is the container itself. Use the real hostname or LAN IP of the target, and if you are checking other containers, make sure they share a Docker network or use their service names.
A service flaps between UP and DOWN constantly. Your interval is too aggressive or your retry count is too low for a flaky link. Raise the retries to 2–3 so a single dropped check doesn’t declare an outage, and consider lengthening the interval for targets on the far side of a home internet connection.
TLS certificate warnings for a cert you know is valid. The check follows the certificate chain as presented; a server serving an incomplete chain will trip it even though a browser papers over the gap. Fix the chain on the server side — the warning is correct.
Notifications never arrive. Test them from the notification settings page, which sends a one-off. If the test fails, it is credentials or reachability (a webhook the container can’t reach, a bad token). If the test succeeds but real alerts don’t, confirm the notification is actually attached to the monitor — they are configured globally but must be enabled per monitor.
The database is locked / the UI hangs under load. SQLite is single-writer, and pointing hundreds of monitors at very short intervals can contend. For a homelab this is rare; if you hit it, lengthen intervals and thin out the monitors you don’t truly need rather than reaching for a heavier database.
The verdict
Uptime Kuma is the first thing I install on a new homelab now, ahead of almost anything else, because it is what tells me when everything else has gone wrong. It is genuinely a joy: one container, no dependencies, a beautiful dashboard, sane notifications, TLS expiry watching thrown in, and a push endpoint that quietly covers your cron jobs. The ceiling is real — it answers “is this up?” and stops there, so it is no substitute for the metrics and logs you need to work out why something is down, which is where aggregating your logs in Loki picks up the story. As the tripwire that turns a silent three-day outage into a phone notification within a minute, though, nothing I have used is better value for the ten minutes it takes to set up.
Related Content