From Logs to Insights: Building a Real-Time SIEM Pipeline with Open-Source Tools
Harness the power of your data without breaking the bank
I added a SIEM to my home lab the day I realised I had no idea what was talking to what. A device had started phoning out to an address I did not recognise, and the only reason I caught it was a fluke glance at the firewall. That is no way to run anything. The fix was a pipeline that collects every log my machines produce, parses it into something queryable, and shouts at me when a pattern looks wrong — in real time, not three weeks later when I happen to look. Commercial SIEM platforms do this beautifully and charge per gigabyte ingested, which for a busy home network is an absurd bill. The open-source Elastic Stack does the same job for the cost of the RAM it eats, and that RAM bill is the real catch nobody warns you about.
This is how I built mine, what each piece does and why, and the gotchas that will otherwise eat an evening.
1 The architecture, in plain terms
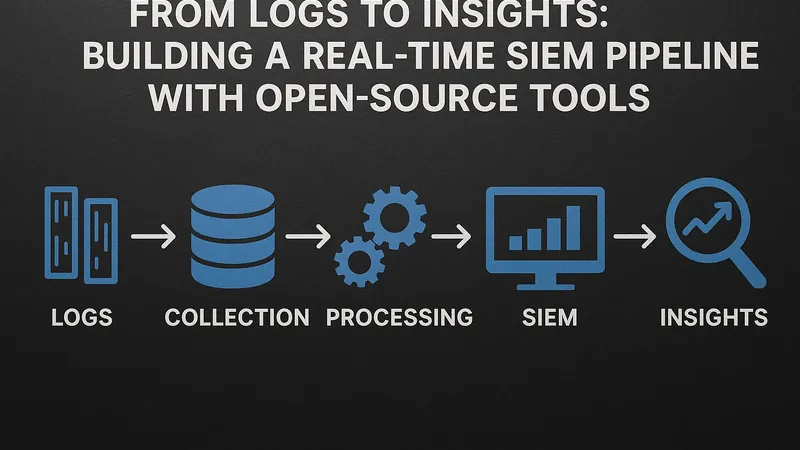
A SIEM is just a log pipeline with teeth. Logs are born on your servers, network gear, and applications; they need to be shipped somewhere central, parsed into structured fields, stored so you can search them fast, visualised so patterns are obvious, and alerted on so you do not have to stare at a screen. The classic open-source answer is the ELK Stack — Elasticsearch for storage and search, Logstash for parsing, Kibana for visualisation — plus lightweight Beats agents to do the shipping.
The data flows in one direction:
[servers / firewall / apps]
        │  (Filebeat / Winlogbeat ship raw logs)
        ▼
   [Logstash]  ← parses, enriches (geo-IP, threat feeds), normalises
        │
        ▼
 [Elasticsearch]  ← indexes and stores; this is where search lives
        │
   ┌────┴────┐
   ▼         ▼
[Kibana]  [ElastAlert 2]  ← dashboards & rule-based alerting
Each arrow is a place something can go wrong, which is precisely why understanding the flow beats following a copy-paste recipe.
2 Shipping the logs
You do not point Logstash at your servers; you put a small agent on each server that forwards to Logstash. The Beats family is the standard choice: Filebeat for log files, Winlogbeat for Windows event logs, Metricbeat for system metrics. They are deliberately tiny — a few megabytes of memory — because they run everywhere. A minimal Filebeat config that tails the auth log and ships it on looks like this:
# /etc/filebeat/filebeat.yml
filebeat.inputs:
  - type: filestream
    id: auth-log
    paths:
      - /var/log/auth.log

output.logstash:
  hosts: ["192.168.1.60:5044"]
Normalise early. If one machine logs timestamps in UTC and another in local time, you will chase phantom gaps forever. Decide on a single timezone and structured field naming at the shipping stage, not after the data is already a mess in the index.
3 Parsing and enriching with Logstash
Raw logs are unstructured strings; Elasticsearch is far more useful when those strings become fields you can filter and aggregate. Logstash does that transformation with a pipeline of input, filter, and output stages. The grok filter — pattern matching for log lines — is the workhorse, and the geoip filter turns a source IP into a country and coordinates so a map of where your traffic comes from becomes trivial.
# /etc/logstash/conf.d/ssh.conf
input {
  beats { port => 5044 }
}
filter {
  grok {
    match => { "message" => "Failed password for %{USERNAME:user} from %{IP:src_ip}" }
  }
  geoip { source => "src_ip" }
}
output {
  elasticsearch {
    hosts => ["http://localhost:9200"]
    index => "auth-%{+YYYY.MM.dd}"
  }
}
This single rule turns a wall of “Failed password” lines into a structured, mappable, alertable dataset. Enriching with a threat-intelligence feed at this stage — tagging any source IP that appears on a known-bad list — is what turns a log archive into something that earns the name “security” pipeline.
A word on where to do the heavy lifting. You can let Beats ship straight to Elasticsearch and skip Logstash entirely, using Elasticsearch ingest pipelines for parsing. That is lighter, and for simple cases it is the right call. But Logstash earns its keep the moment you need to fan logs out to multiple destinations, buffer through a queue during an Elasticsearch hiccup, or run enrichment that ingest pipelines handle awkwardly. My rule of thumb: start without Logstash, and add it the first time you wish you had a buffer. If your log volume ever gets serious, slot a message queue such as Kafka or Redis between the shippers and Logstash so a burst of events never overruns the parser — the agents write to the queue, Logstash drains it at its own pace, and nothing is lost when one component restarts.
4 Storing, searching, and visualising
Elasticsearch holds the indexed data and answers queries in milliseconds even across millions of events. The detail that will save or sink you is Index Lifecycle Management (ILM): define a policy that rolls indices over by age or size and deletes them after a retention window, or your disk fills and the whole cluster goes read-only. Set this up on day one, not after the first outage.
Kibana is the window onto all of it. You build dashboards — failed logins over time, a geo-map of inbound connections, top talkers by bytes — and suddenly the anomaly that started this whole project would have jumped out in a glance. The same discipline of “see what is actually happening on your network” is why I run lightweight uptime checks alongside the heavy SIEM; for the gentler end of that spectrum, Uptime Kuma covers availability without any of the resource cost discussed below.
5 Alerting in real time
A dashboard you have to look at is not real-time detection. You need rules that fire on their own. ElastAlert 2 (the community-maintained successor to the original ElastAlert) queries Elasticsearch on a schedule and triggers an action — email, a webhook, a chat message — when a rule matches. A “five failed logins from one IP in a minute” rule is a few lines of YAML:
name: ssh-bruteforce
type: frequency
index: auth-*
num_events: 5
timeframe:
  minutes: 1
filter:
  - query:
      query_string:
        query: "message:\"Failed password\""
alert:
  - "email"
email:
  - "[email protected]"
Elastic’s own built-in alerting in newer Kibana versions can do much of this too; ElastAlert 2 remains popular because it is simple, self-contained, and decoupled from licence tiers.
6 What to actually watch for
A pile of dashboards is useless if you do not know what a problem looks like. The detections that have earned their place in my lab are unglamorous and high-signal:
- Brute-force bursts — many failed logins from one source in a short window, the rule shown above. The classic, and still the most frequently triggered.
- A successful login after a string of failures from the same IP. This is the one that should make your stomach drop: it means the guessing stopped because the guessing worked. Far more important than the failures alone.
- Logins from an unexpected country. Once
geoipis enriching your auth events, a session sourced from a place none of your users live is an immediate flag. Cheap to build, surprisingly effective. - Root or sudo activity outside your own maintenance windows. Privilege escalation at 3am when you were asleep is worth an alert every time.
- A sudden drop in log volume from a host. Silence is data. If a machine that normally chatters goes quiet, either it is down or something is suppressing its logging — both warrant a look.
That last one matters because it guards the SIEM against the attacker’s favourite move: turning off the very logging that would expose them. Tuning these rules to your own baseline is the ongoing work; the first month is mostly silencing false positives until the alerts that survive are ones you genuinely act on. Treat a SIEM the way you would any other piece of infrastructure you depend on day to day — like the principles I lay out in building in public on your own infrastructure, the value compounds only if you keep tending it.
7 The gotchas nobody warns you about
Elasticsearch is a RAM glutton. This is the headline catch. A single node wants a couple of gigabytes of JVM heap minimum to be anything but miserable, and the official guidance is to set the heap to roughly half your available memory while leaving the other half for the OS file cache. On a 4 GB box it will swap and crawl; budget 8 GB and up for the data node alone. This is the line item that makes people quietly abandon the project, so size for it honestly before you start — the broader maths of what self-hosting actually costs in hardware and time is something I have laid out in the real cost of self-hosting.
vm.max_map_count too low. Elasticsearch refuses to start on Linux until you raise this kernel setting: sudo sysctl -w vm.max_map_count=262144 (and persist it in /etc/sysctl.conf). The error message is cryptic; this is almost always the cause of a node that dies on boot.
Grok patterns that silently fail. If a grok filter does not match, Logstash tags the event _grokparsefailure and ships it anyway, unparsed. Your dashboards then quietly miss data and you assume all is well. Search for that tag regularly and treat its presence as a parsing bug to fix.
Unbounded indices. Without ILM, indices grow forever. The failure mode is brutal: the disk hits its watermark, Elasticsearch flips every index to read-only to protect itself, and ingestion stops dead. You only notice when the alerts stop arriving — at which point the SIEM has failed silently, the worst kind of failure for a security tool.
Shipping logs in the clear. Beats-to-Logstash and Logstash-to-Elasticsearch traffic should be TLS-encrypted and authenticated. A SIEM that broadcasts your auth logs across the LAN in plaintext is a liability, not a defence.
8 Is it worth it? Who is this for
If you run more than a handful of machines, care about security, and have a spare box with real memory to give, a self-hosted Elastic Stack SIEM is genuinely transformative — you stop guessing about your network and start seeing it. The visibility paid for itself the first time it caught something my eyeballs would have missed.
But be honest about the cost. This is not a Raspberry Pi project; Elasticsearch’s appetite for RAM is the deciding factor, and the ongoing care — tuning grok rules, managing index lifecycles, keeping the stack patched — is a real, recurring time commitment. If you have two servers and a router, this is overkill, and a few good fail2ban and CrowdSec rules plus centralised log forwarding will serve you better for a fraction of the effort. The full SIEM is for the person whose lab has grown past the point where ad-hoc log-grepping scales — and for that person, the day it catches the thing you would otherwise have missed, the RAM bill suddenly looks cheap.
Related Content